Stop Guessing.
Start Winning.
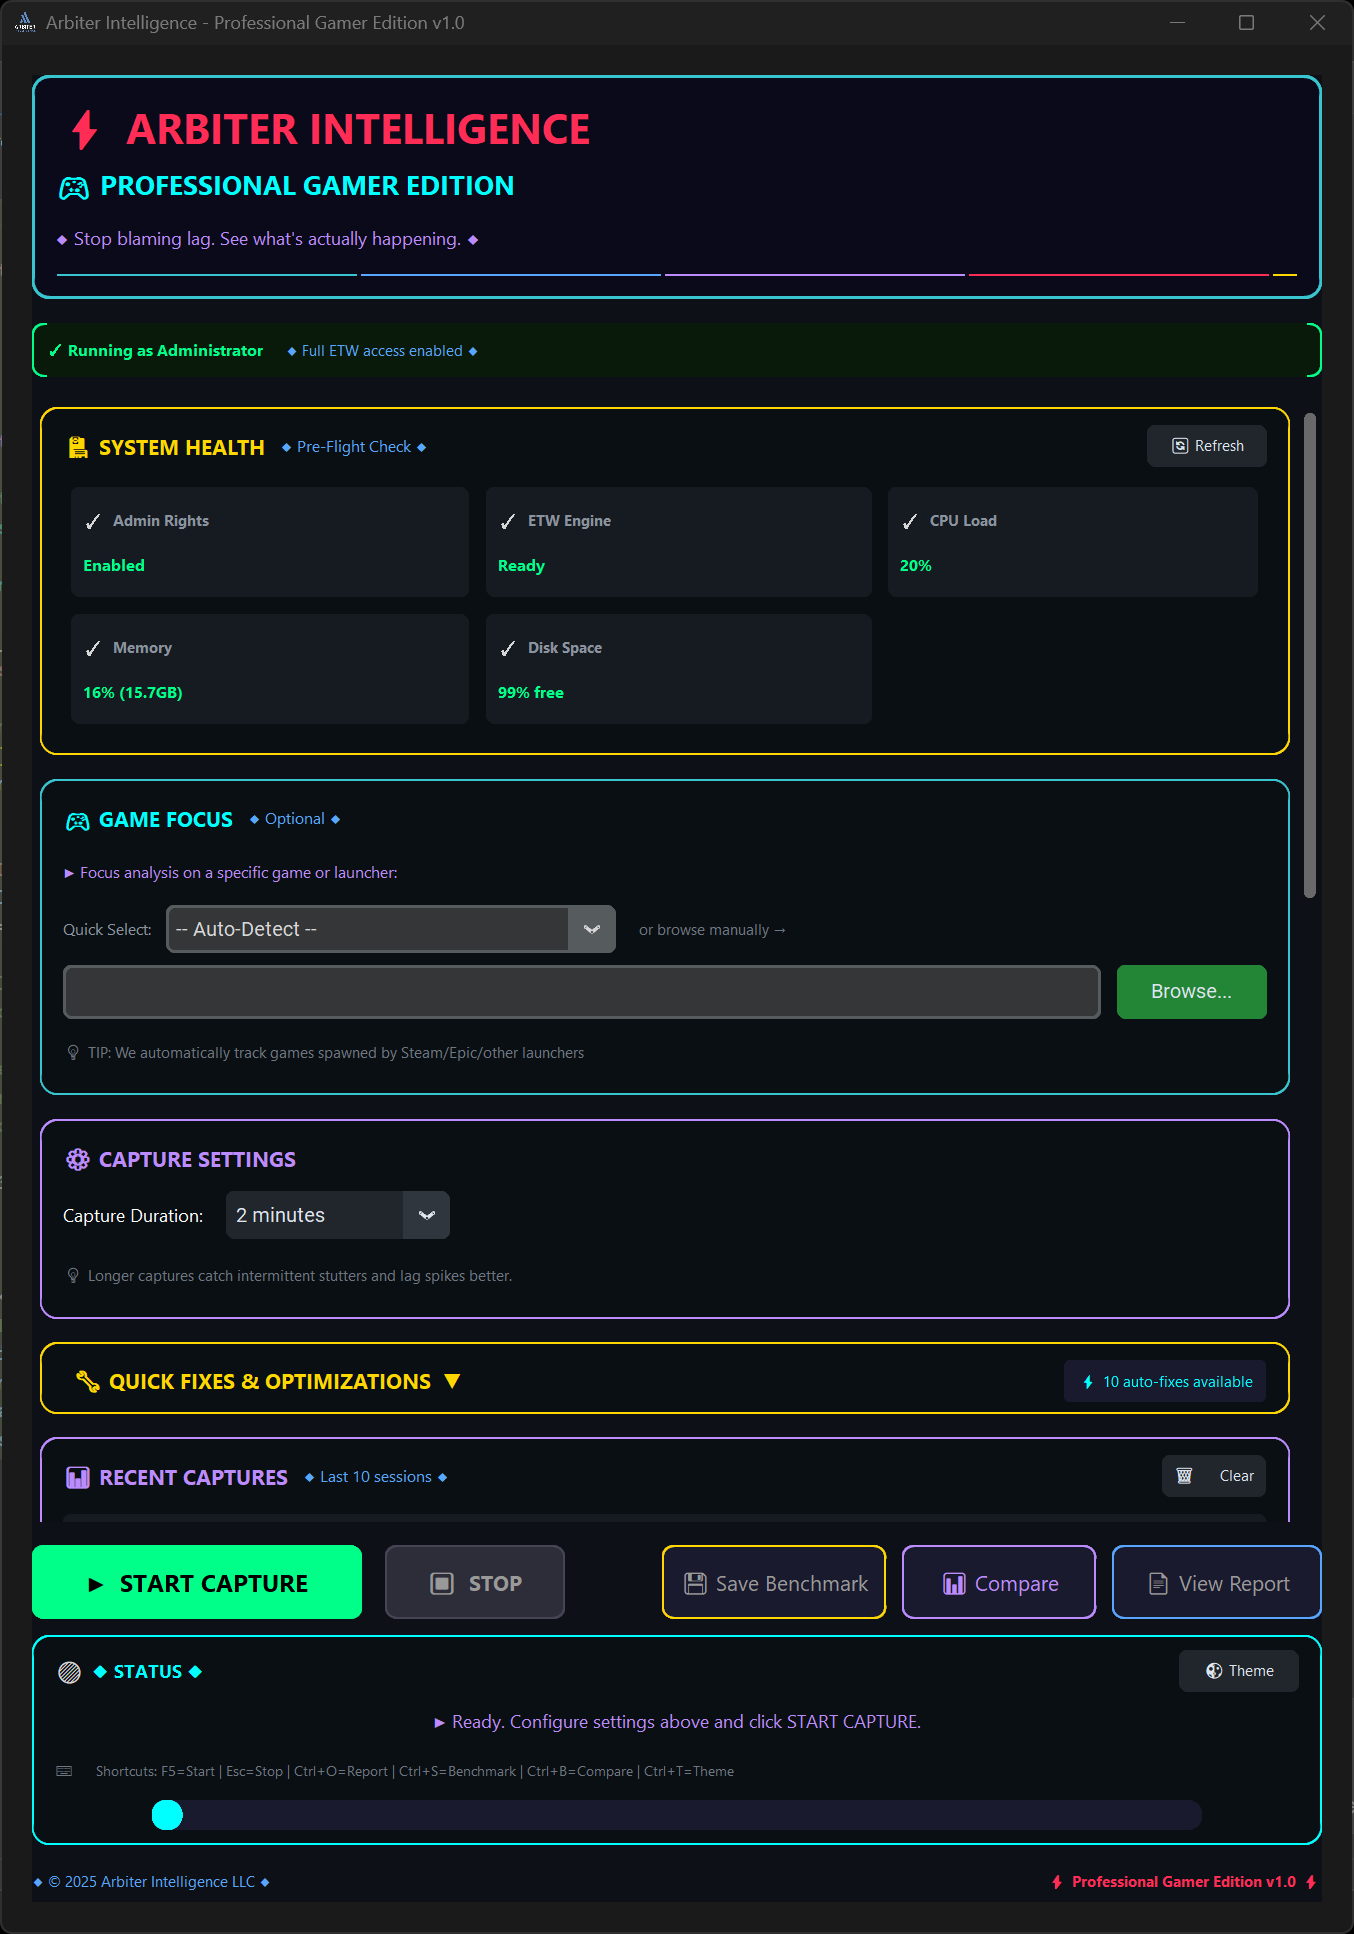
Arbiter Intelligence analyzes your gaming PC with frame-perfect precision, identifies bottlenecks using deterministic rule-based logic, and provides guided Quick Fix buttons you control.
Every major metric includes plain-language context with dual tooltip support: custom hover cards plus native browser fallback.
Typical outcomes from internal and customer test captures. Actual results vary by hardware, game engine, drivers, Windows state, and selected fixes. No specific performance improvement is guaranteed. Methodology · Terms
The Problem with Modern PC Gaming
High-end hardware doesn't guarantee smooth performance
Invisible Bottlenecks
Is your CPU or GPU holding you back? Most tools can't tell you.
Mysterious Stuttering
Frame drops and micro-stutters ruin gameplay, but what's causing them?
200+ Settings
Modern games have hundreds of options. Which ones actually matter?
Generic Advice
Online guides don't account for YOUR specific hardware combination.
Comprehensive Performance Analysis
Professional-grade diagnostics covering every aspect of your gaming PC
Advanced Deterministic Intelligence Engine
Multi-layer deterministic rule engine with correlation analysis, pattern detection, and root cause identification—finds issues other tools miss.
- Cross-Metric Correlation: Links DPC latency spikes to specific driver/process activity
- Causal Chain Analysis: Traces cascading issues (e.g., memory leak → paging → disk I/O → stuttering)
- Pattern Recognition: Detects malware signatures, telemetry storms, update interference
- Root Cause Graphing: Visual Mermaid.js graphs showing dependency chains
- Trend Insights: Highlights recurring degradation patterns across captures
- Context-Aware Insights: Rule-based profiling evaluates your hardware tier and adjusts recommendations
- Thermal Throttling Detection: Pinpoints when heat limits performance
- Upgrade Recommendations: Data-driven advice on CPU vs GPU vs RAM upgrades
Microsecond Frame Timing Analysis
PresentMon integration delivers the most accurate frame timing available—every single frame, microsecond-level precision.
- GPU render time: How long your GPU takes to render each frame
- Display latency: Time from render completion to screen display
- Present mode detection: Hardware Flip, Composed Flip, or legacy modes
- Frame pacing consistency: Detect micro-stutters invisible to FPS counters
- VSync analysis: Is VSync helping or hurting your experience?
- 1% Low / 0.1% Low: Industry-standard worst-case frame times
Dual Timeline Visualization
See system-level and GPU-level performance side-by-side to understand the complete picture.
- System Timeline: CPU utilization, DPC interrupts, power events, context switches
- GPU Timeline: Per-frame render times, VRAM usage, GPU clock speeds, temperature
- Synchronized view: Correlate system events with GPU stutters
- Zoom and pan: Drill down to individual frame spikes
- Event markers: Highlight thermal throttling, power limit hits, driver resets
- Overlay comparison: Before/after optimization side-by-side
Robust Tooltip Intelligence
Dense report panels stay readable while preserving deep context on demand with resilient tooltip behavior.
- Two-layer delivery: Rich in-report tooltip cards plus native browser title fallback
- Coverage-first UX: Metric tiles, verdict headers, and diagnostics cards expose quick explanations
- Readable context: Tooltips include what it means, impact, and actionable fix direction
- Graceful degradation: If custom rendering is blocked, standard tooltips still appear
- Fast triage: Users can scan visual status first, then hover for immediate interpretation
Hardware Health Check & Visual Diagnostics
Interactive motherboard component map with real-time health indicators—instantly see what's working and what needs attention.
- Component Health Map: Visual system diagram showing CPU, RAM, PCIe slots, storage, and peripherals
- Color-coded status: Green (healthy), orange (warnings), red (critical issues) at a glance
- CPU monitoring: Per-core utilization, clock speeds, C-states, temperature
- GPU telemetry: Utilization, VRAM, core/memory clocks, temperature, power draw
- Memory analysis: RAM usage, page file activity, memory pressure events
- Disk I/O tracking: Identify loading stutters from slow storage
- Power events: Detect power plan changes, battery saver mode (laptops)
- Thermal tracking: CPU/GPU temperature correlation with throttling
Experience Scoring System
Comprehensive 0-100 system health score with 7-category breakdown showing exactly where your system excels or needs work.
- Playability Score (25%): Frame pacing smoothness—the most important metric
- Driver Health (15%): DPC latency, bad driver detection, kernel overhead
- Background Load (15%): CPU stolen by non-game processes
- Thermal Score (10%): Temperature monitoring and throttling detection
- Latency Score (15%): Interrupt latency and responsiveness
- Memory Score (10%): RAM pressure, page faults, allocation health
- Storage Score (10%): Disk I/O bottleneck analysis
Pre-Game Health Check
Run a comprehensive system scan BEFORE gaming to catch issues that would ruin your session.
- GPU Driver Validation: Check for known-bad driver versions before launch
- Pending Restart Detection: Alert if Windows Update needs a reboot
- Background Process Scan: Identify CPU/disk hogs before they cause stutters
- Thermal Baseline: Ensure system isn't already hot before gaming starts
- RAM Availability: Verify sufficient memory for game + OS overhead
- 0-100 Readiness Score: Single number showing if you're ready to game
Forensic Deep Analysis
Professional-grade forensic tools for diagnosing complex issues—goes deeper than surface metrics.
- Per-Core CPU Analysis: Identify which specific cores are bottlenecked or parked
- Kernel-Level Tracing: ETW captures context switches, DPCs, ISRs at microsecond precision
- Process Ancestry Tracking: Understand which parent processes spawned resource hogs
- Driver DPC Attribution: Pinpoint exact driver modules causing latency
- Memory Pattern Analysis: Detect memory leaks and allocation patterns
- Game Crash Diagnosis: Analyze crash dumps and event logs for root causes
Network & System Diagnostics
Monitor background processes, network activity, and system interrupts that impact gaming.
- Background CPU hogs: Identify processes stealing CPU during gaming
- DPC/ISR analysis: Detect driver-level interrupt storms
- Network latency: Track network-induced frame time spikes
- Windows Update detection: Catch updates running during gameplay
- Antivirus interference: Identify real-time scanning causing stutters
- Audio buffer underruns: Detect audio driver issues
Advanced Performance Metrics
Industry-standard metrics used by professional reviewers and competitive gamers.
- 1% Low / 0.1% Low FPS: Worst-case frame rates (more important than average!)
- Frame time variance: Measure consistency—low variance = smooth gameplay
- Stutter detection: Automatically flag frame spikes above threshold
- Smoothness score: 0-100 rating based on frame pacing consistency
- Percentile distributions: 25th, 50th, 75th, 95th, 99th percentile frame times
- Benchmark comparisons: How does your system compare to similar configs?
Intelligent Remediation Engine
Four-phase guided fix system with safe rollback—from universal tweaks to capture-specific recommendations.
- Phase 1 - Universal Fixes: Game DVR disable, high-performance power, GPU scheduling
- Phase 2 - Game-Specific: Tailored settings from 50+ game optimization database
- Phase 3 - Capture-Based: Dynamic recommendations from actual session analysis
- Phase 4 - Quick Apply: User-confirmed buttons with admin elevation when needed
- Risk Assessment: Low/Medium/High labels for each fix with impact warnings
- Rollback Support: Revert any fix with backed-up original settings
- Category Organization: Windows, GPU, Power, Network, Audio, Process fixes
- 10+ Quick Fixes: Power, capture settings, and common Windows gaming tweaks
Benchmark Comparison & Tracking
Save performance snapshots and compare before/after results to measure improvements from upgrades, patches, or optimizations.
- Save Benchmarks: Preserve any capture as a named baseline (Ctrl+S)
- Side-by-Side Comparison: Visual diff showing FPS gains/losses (Ctrl+B)
- Patch Impact Analysis: Quantify performance changes from driver/game updates
- Hardware Upgrade Tracking: Measure exact FPS improvement from new GPU/CPU
- Regression Detection: Before/after benchmark comparison highlights degradations
- CSV Export: Export benchmarks to spreadsheets for custom analysis
Enhanced Export & Sharing
Share your results in whatever format works best—from beautiful Discord posts to professional spreadsheets.
- Interactive HTML: Full report with zoomable charts and hover tooltips
- Beautiful Discord Export: ASCII box art with PresentMon analysis and GPU telemetry
- Reddit-Ready Format: Perfect for r/buildapc and r/techsupport threads
- JSON Export: Raw data for programmatic analysis
- CSV Export: Frame-by-frame data for Excel/Python analysis
- Privacy controls: Optionally remove system info before sharing
Game-Specific Intelligence
Tailored analysis for 50+ popular games with community baselines and optimization tips.
- Automatic detection: Recognizes game from process name
- Performance baselines: "Your RTX 3080 is getting 95 FPS, typical is 85-110"
- Game-specific tips: Known issues and optimization guides
- Universal analysis: Unrecognized games get full diagnostics too
- Multi-game tracking: Compare performance across different titles
- Session history: Track performance over time, before/after patches
Get Optimized in 3 Simple Steps
Professional-grade analysis in just 5 minutes
Capture Performance
Launch Arbiter, click "Start Analysis", and play your game normally for 5 minutes. That's it.
Duration: 3:42
FPS: 61
Review Deterministic Insights
Arbiter analyzes thousands of data points and generates an interactive report with clear, rule-based explanations.
Your RTX 3080 is at 98% utilization while CPU is only 45%. Lower resolution or quality settings for higher FPS.
Apply Optimizations
Review recommendations and apply Quick Fix buttons you choose. Re-test to measure improvement.
Professional Interface, Zero Complexity
Powerful analysis tools with an intuitive, gamer-focused design
🎮 Game Focus Mode
Recognizes 50+ popular titles with optimized baselines. Works with any game—recognized games get tailored comparisons, unrecognized games get universal performance analysis.
⚡ One-Click Fixes
Apply 10+ guided Quick Fixes with confirmation and rollback support. You choose what to apply.
📈 Session History
Recent captures panel tracks your optimization journey. Compare before/after results and measure FPS improvements.
Why Arbiter Intelligence?
Feature comparison with popular alternatives
| Feature | Arbiter Intelligence | MSI Afterburner | CapFrameX | GeForce Experience |
|---|---|---|---|---|
| FPS Monitoring | ✅ + 1% Lows | ✅ Basic | ✅ Advanced | ❌ |
| Frame Timing Analysis | ✅ PresentMon | ❌ | ✅ PresentMon | ❌ |
| Rule-Based Bottleneck Detection | ✅ Deterministic Rule-Based | ❌ Manual | ❌ | ❌ |
| One-Click Fixes | ✅ 10+ Fixes | ❌ | ❌ | ⚠️ Generic |
| Interactive Reports | ✅ Beautiful | ❌ Logs Only | ⚠️ Static | ❌ |
| Discord/Reddit Export | ✅ Formatted | ❌ | ❌ | ❌ |
| Ease of Use | ✅ Simple | ⚠️ Complex | ⚠️ Manual | ✅ Simple |
| GPU Support | ✅ All GPUs | ✅ All GPUs | ✅ All GPUs | ⚠️ NVIDIA Only |
Available Exclusively on Steam
Get the competitive edge with professional performance analysis